> ## Documentation Index
> Fetch the complete documentation index at: https://docs.shuttle.dev/llms.txt
> Use this file to discover all available pages before exploring further.
# Better Stack Integration
> How to set up Better Stack monitoring with Shuttle
This guide will walk you through setting up Better Stack as your telemetry provider for Shuttle.
## Prerequisites
1. A [Better Stack account](https://betterstack.com/) (sign up if you don't have one)
## Step 1: Create a Telemetry Source in Better Stack
1. Log in to your Better Stack account
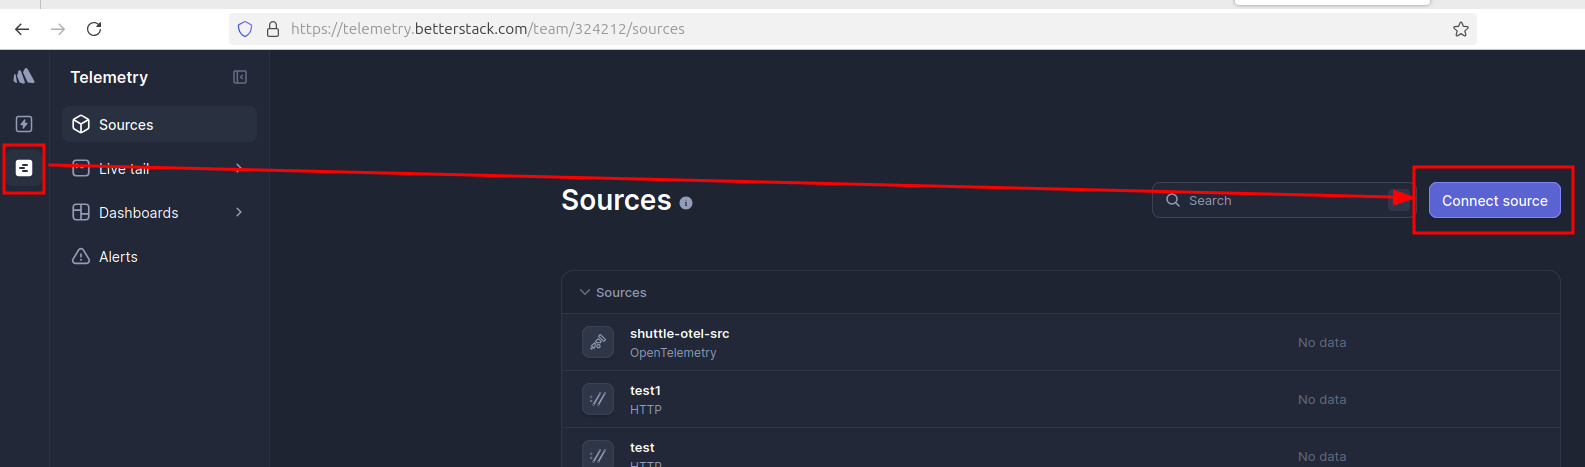
2. Navigate to the **Sources** section
3. Click **Connect Source**
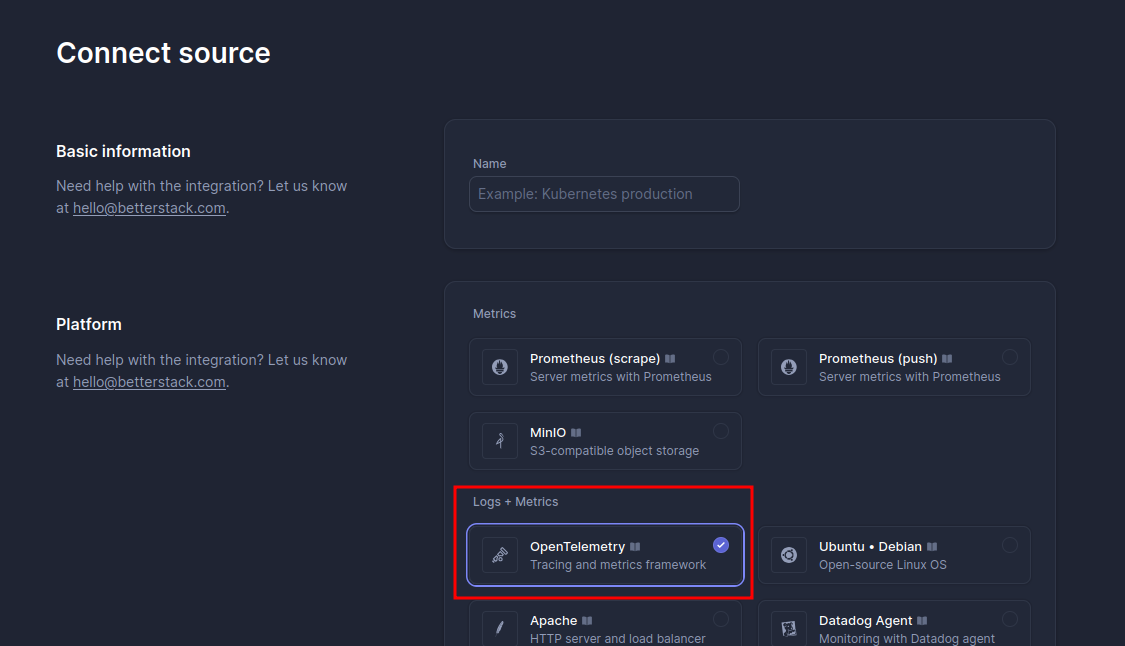
4. Choose a name for your telemetry source
5. Select the OpenTelemetry option in the "platform" section
6. Click "Connect Source" at the bottom of the page
 ## Step 2: Configure Shuttle Project
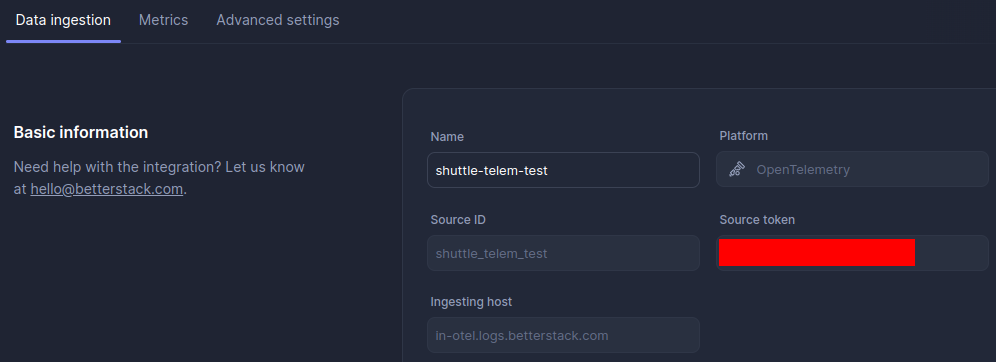
1. On the Source configuration page, locate and copy:
* Your source token
* The ingestion host URL
## Step 2: Configure Shuttle Project
1. On the Source configuration page, locate and copy:
* Your source token
* The ingestion host URL
 2. In the Shuttle Console:
* Navigate to your project
* Go to the "Telemetry" tab
* Click to enable Better Stack
* Paste your source token and ingestion host
* Click "Apply"
## Step 3: Enable OpenTelemetry Exporter (optional)
This step is only required if you want to emit custom metrics and logs from your application. If you only need the default CPU, network, and memory metrics, you can skip this step.
Follow the [Getting Started guide](./getting-started#step-1-enable-the-opentelemetry-exporter) to enable the OpenTelemetry exporter in your project.
## Step 4: Redeploy Your Project
**Important**: If your project was already running, you must redeploy it for telemetry to start flowing.
* If you've made code changes (like adding custom metrics), redeploy using the Shuttle CLI: `shuttle deploy`
* If you haven't made any code changes, you can redeploy from the Shuttle Console by selecting your latest deployment and clicking "Redeploy"
## Step 5: Create Dashboards
Once telemetry data starts flowing, you can create custom dashboards in Better Stack:
1. Go to the Dashboards section
2. A new dashboard will be created automatically for your project
3. Click the dots on any widget and select "Configure" to customize it
Better Stack offers several ways to visualize your data:
* SQL queries
* Visual drag-and-drop interface
* PromQL (beta)
### Example: Creating a CPU Usage Graph
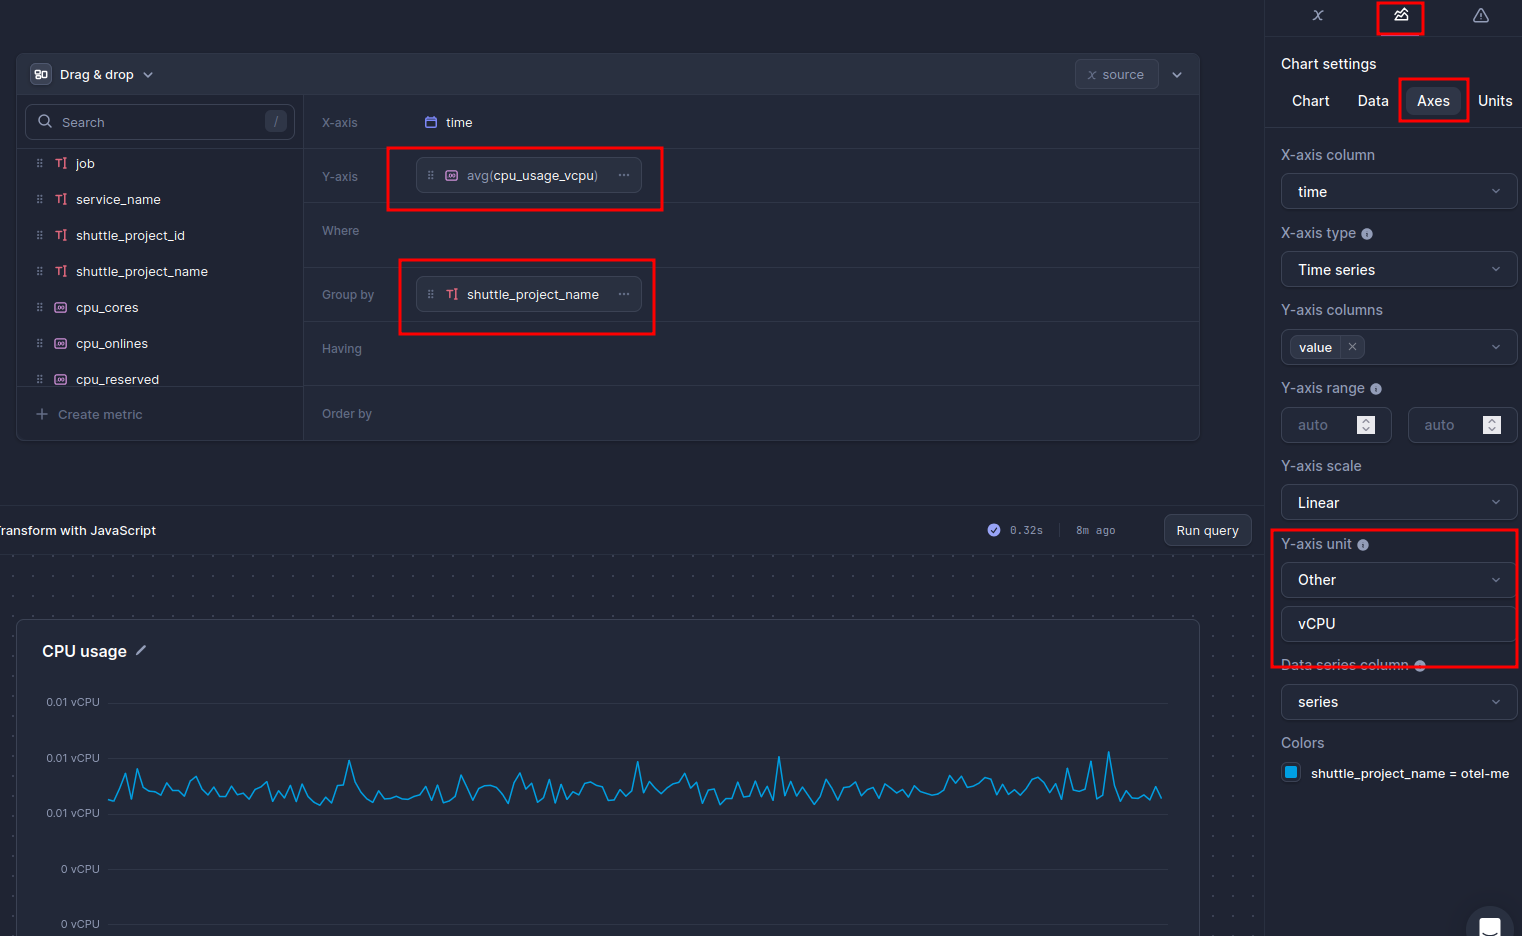
1. Click the dots on a widget and select "Configure"
2. Switch to the visual interface
3. Add `cpu_usage_vcpu` as your metric
4. Set the Y-axis unit to "vCPU"
5. Group by your project name
2. In the Shuttle Console:
* Navigate to your project
* Go to the "Telemetry" tab
* Click to enable Better Stack
* Paste your source token and ingestion host
* Click "Apply"
## Step 3: Enable OpenTelemetry Exporter (optional)
This step is only required if you want to emit custom metrics and logs from your application. If you only need the default CPU, network, and memory metrics, you can skip this step.
Follow the [Getting Started guide](./getting-started#step-1-enable-the-opentelemetry-exporter) to enable the OpenTelemetry exporter in your project.
## Step 4: Redeploy Your Project
**Important**: If your project was already running, you must redeploy it for telemetry to start flowing.
* If you've made code changes (like adding custom metrics), redeploy using the Shuttle CLI: `shuttle deploy`
* If you haven't made any code changes, you can redeploy from the Shuttle Console by selecting your latest deployment and clicking "Redeploy"
## Step 5: Create Dashboards
Once telemetry data starts flowing, you can create custom dashboards in Better Stack:
1. Go to the Dashboards section
2. A new dashboard will be created automatically for your project
3. Click the dots on any widget and select "Configure" to customize it
Better Stack offers several ways to visualize your data:
* SQL queries
* Visual drag-and-drop interface
* PromQL (beta)
### Example: Creating a CPU Usage Graph
1. Click the dots on a widget and select "Configure"
2. Switch to the visual interface
3. Add `cpu_usage_vcpu` as your metric
4. Set the Y-axis unit to "vCPU"
5. Group by your project name
 ## Available Metrics
Better Stack will receive all the standard Shuttle telemetry metrics, including:
* CPU usage and utilization
* Memory usage and limits
* Network I/O statistics
* Disk I/O statistics
* Custom metrics from your application (requires OpenTelemetry exporter from Step 3)
For a complete list of available metrics, see our [telemetry overview](./overview#default-platform-metrics).
## Troubleshooting
If you don't see data in Better Stack:
1. Verify your source token and ingestion host are correct
2. If you're using custom metrics, check that your project has the `setup-otel-exporter` feature on `shuttle-runtime` enabled
3. Ensure you've redeployed your project after enabling telemetry
4. Contact [Better Stack support](https://betterstack.com/contact) or join our [Discord community](https://discord.gg/shuttle) for help
## Available Metrics
Better Stack will receive all the standard Shuttle telemetry metrics, including:
* CPU usage and utilization
* Memory usage and limits
* Network I/O statistics
* Disk I/O statistics
* Custom metrics from your application (requires OpenTelemetry exporter from Step 3)
For a complete list of available metrics, see our [telemetry overview](./overview#default-platform-metrics).
## Troubleshooting
If you don't see data in Better Stack:
1. Verify your source token and ingestion host are correct
2. If you're using custom metrics, check that your project has the `setup-otel-exporter` feature on `shuttle-runtime` enabled
3. Ensure you've redeployed your project after enabling telemetry
4. Contact [Better Stack support](https://betterstack.com/contact) or join our [Discord community](https://discord.gg/shuttle) for help